Primary vs Secondary Emissions Data: Key Differences and When to Use Each
Learn the key differences between primary and secondary emissions data, when to use each, and how better data quality supports more accurate carbon accounting and Scope 3 reporting.


.svg)
Table of Contents


Ask five sustainability managers where their Scope 3 numbers come from and you'll usually get the same answer: "a mix." Some of it is metered. Some of it is supplier-reported. A good chunk is still an industry average multiplied by a spend figure, standing in for data nobody has collected yet.
That mix is normal. It's also becoming a liability. The GHG Protocol's Scope 3 Standard hasn't been substantially updated since 2011. In March 2026, it published a Phase 1 progress update proposing something new: breaking reported Scope 3 emissions down by data quality tier, rather than one blended figure per category. The distinction between primary and secondary data is no longer just a methodology footnote. It's about to become a number investors and auditors can see.
This piece walks through what primary and secondary data mean, when each one earns its place, and what to do about the gap once you know where you stand. If you're weighing this alongside broader questions of methodology, our piece on carbon accounting vs carbon footprint is a useful companion read.
What Is Emissions Data, Exactly?
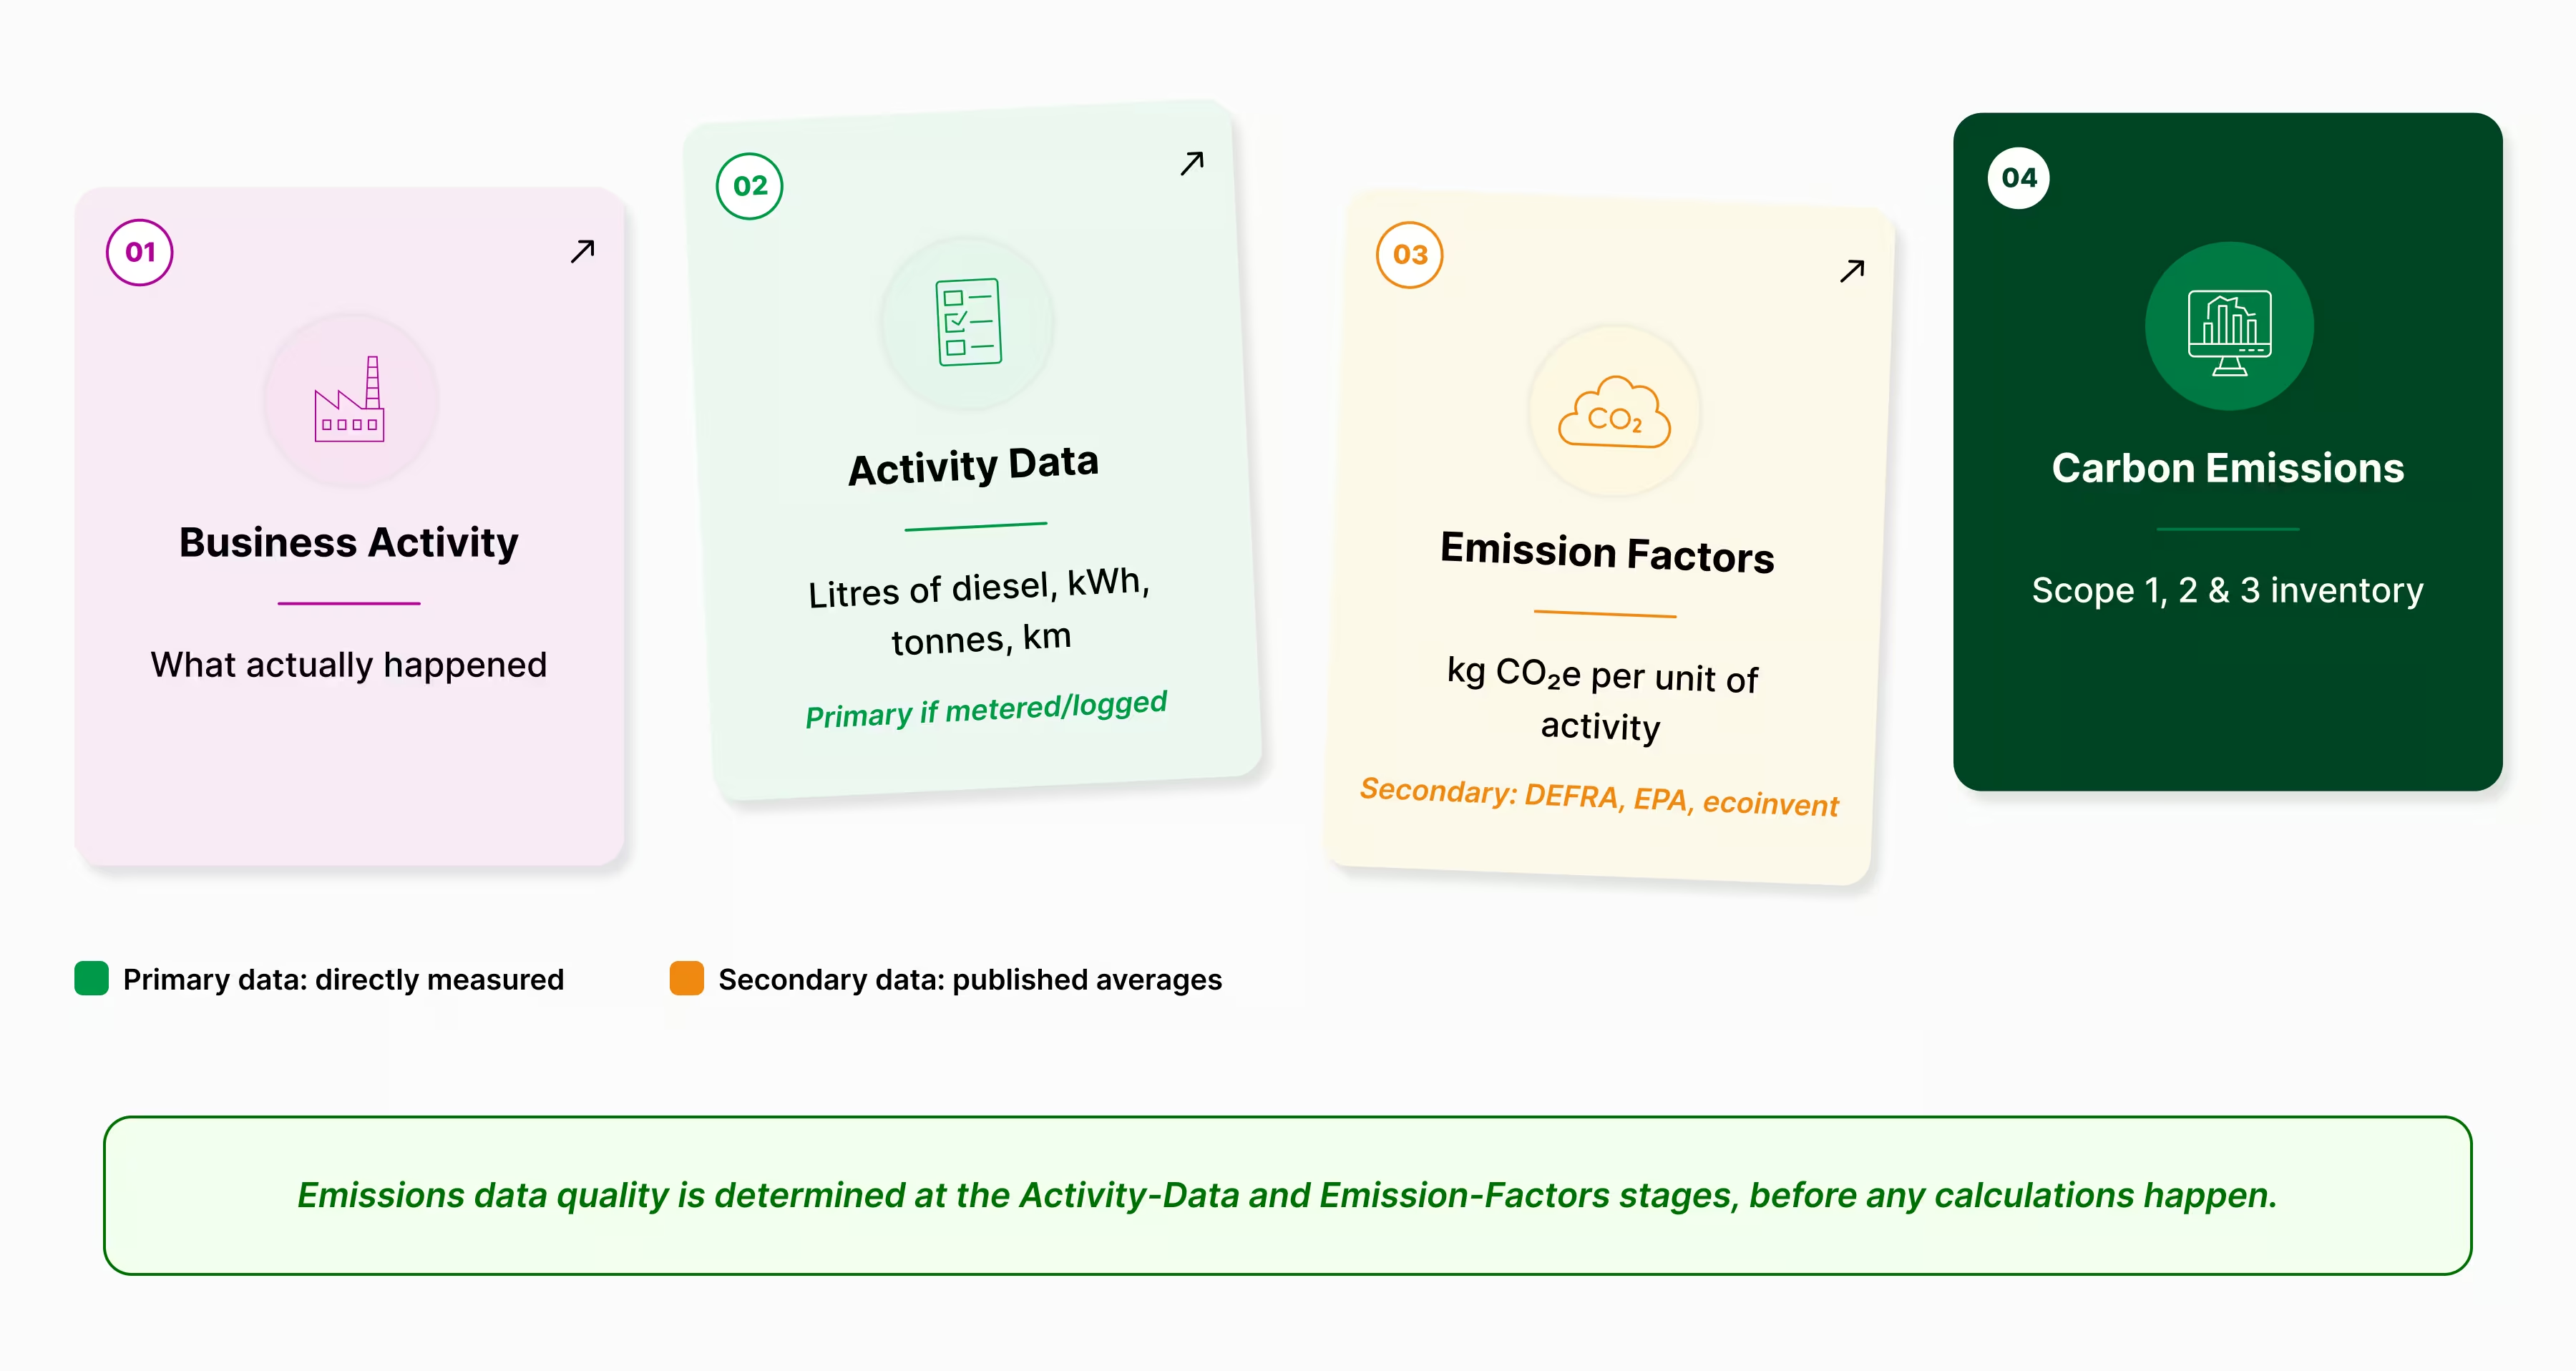
Emissions data is the input that turns business activity into a carbon number. It works in three layers:
Activity data is what actually happened: litres of diesel burned, kilowatt-hours drawn from the grid, tonnes of steel purchased, kilometres a shipment travelled.
Emission factors convert that activity into greenhouse gas output: how many kilograms of CO2e per litre of diesel, per kWh, per tonne of steel.
Carbon accounting multiplies the two together, category by category, to build a full inventory across Scope 1, Scope 2, and Scope 3.
The quality of the final number depends entirely on where those first two inputs come from. That's the real question behind "primary vs secondary data": not which one is correct, but which one is precise enough for what you're using it for. (For a fuller breakdown of how these categories fit together, see our guide to Scope 1, 2, and 3 Emissions: What Every Business Needs to Know.)
What Is Primary Emissions Data?
Primary data is collected directly from the source it describes. It's specific to your operations or to a named supplier, not borrowed from an industry-wide average.
Common examples:
- Fuel consumption from vehicle logs or fuel cards
- Electricity bills tied to a specific site or meter
- Manufacturing output pulled from production records
- Product carbon footprints supplied directly by a vendor
- Direct meter readings from equipment or facilities
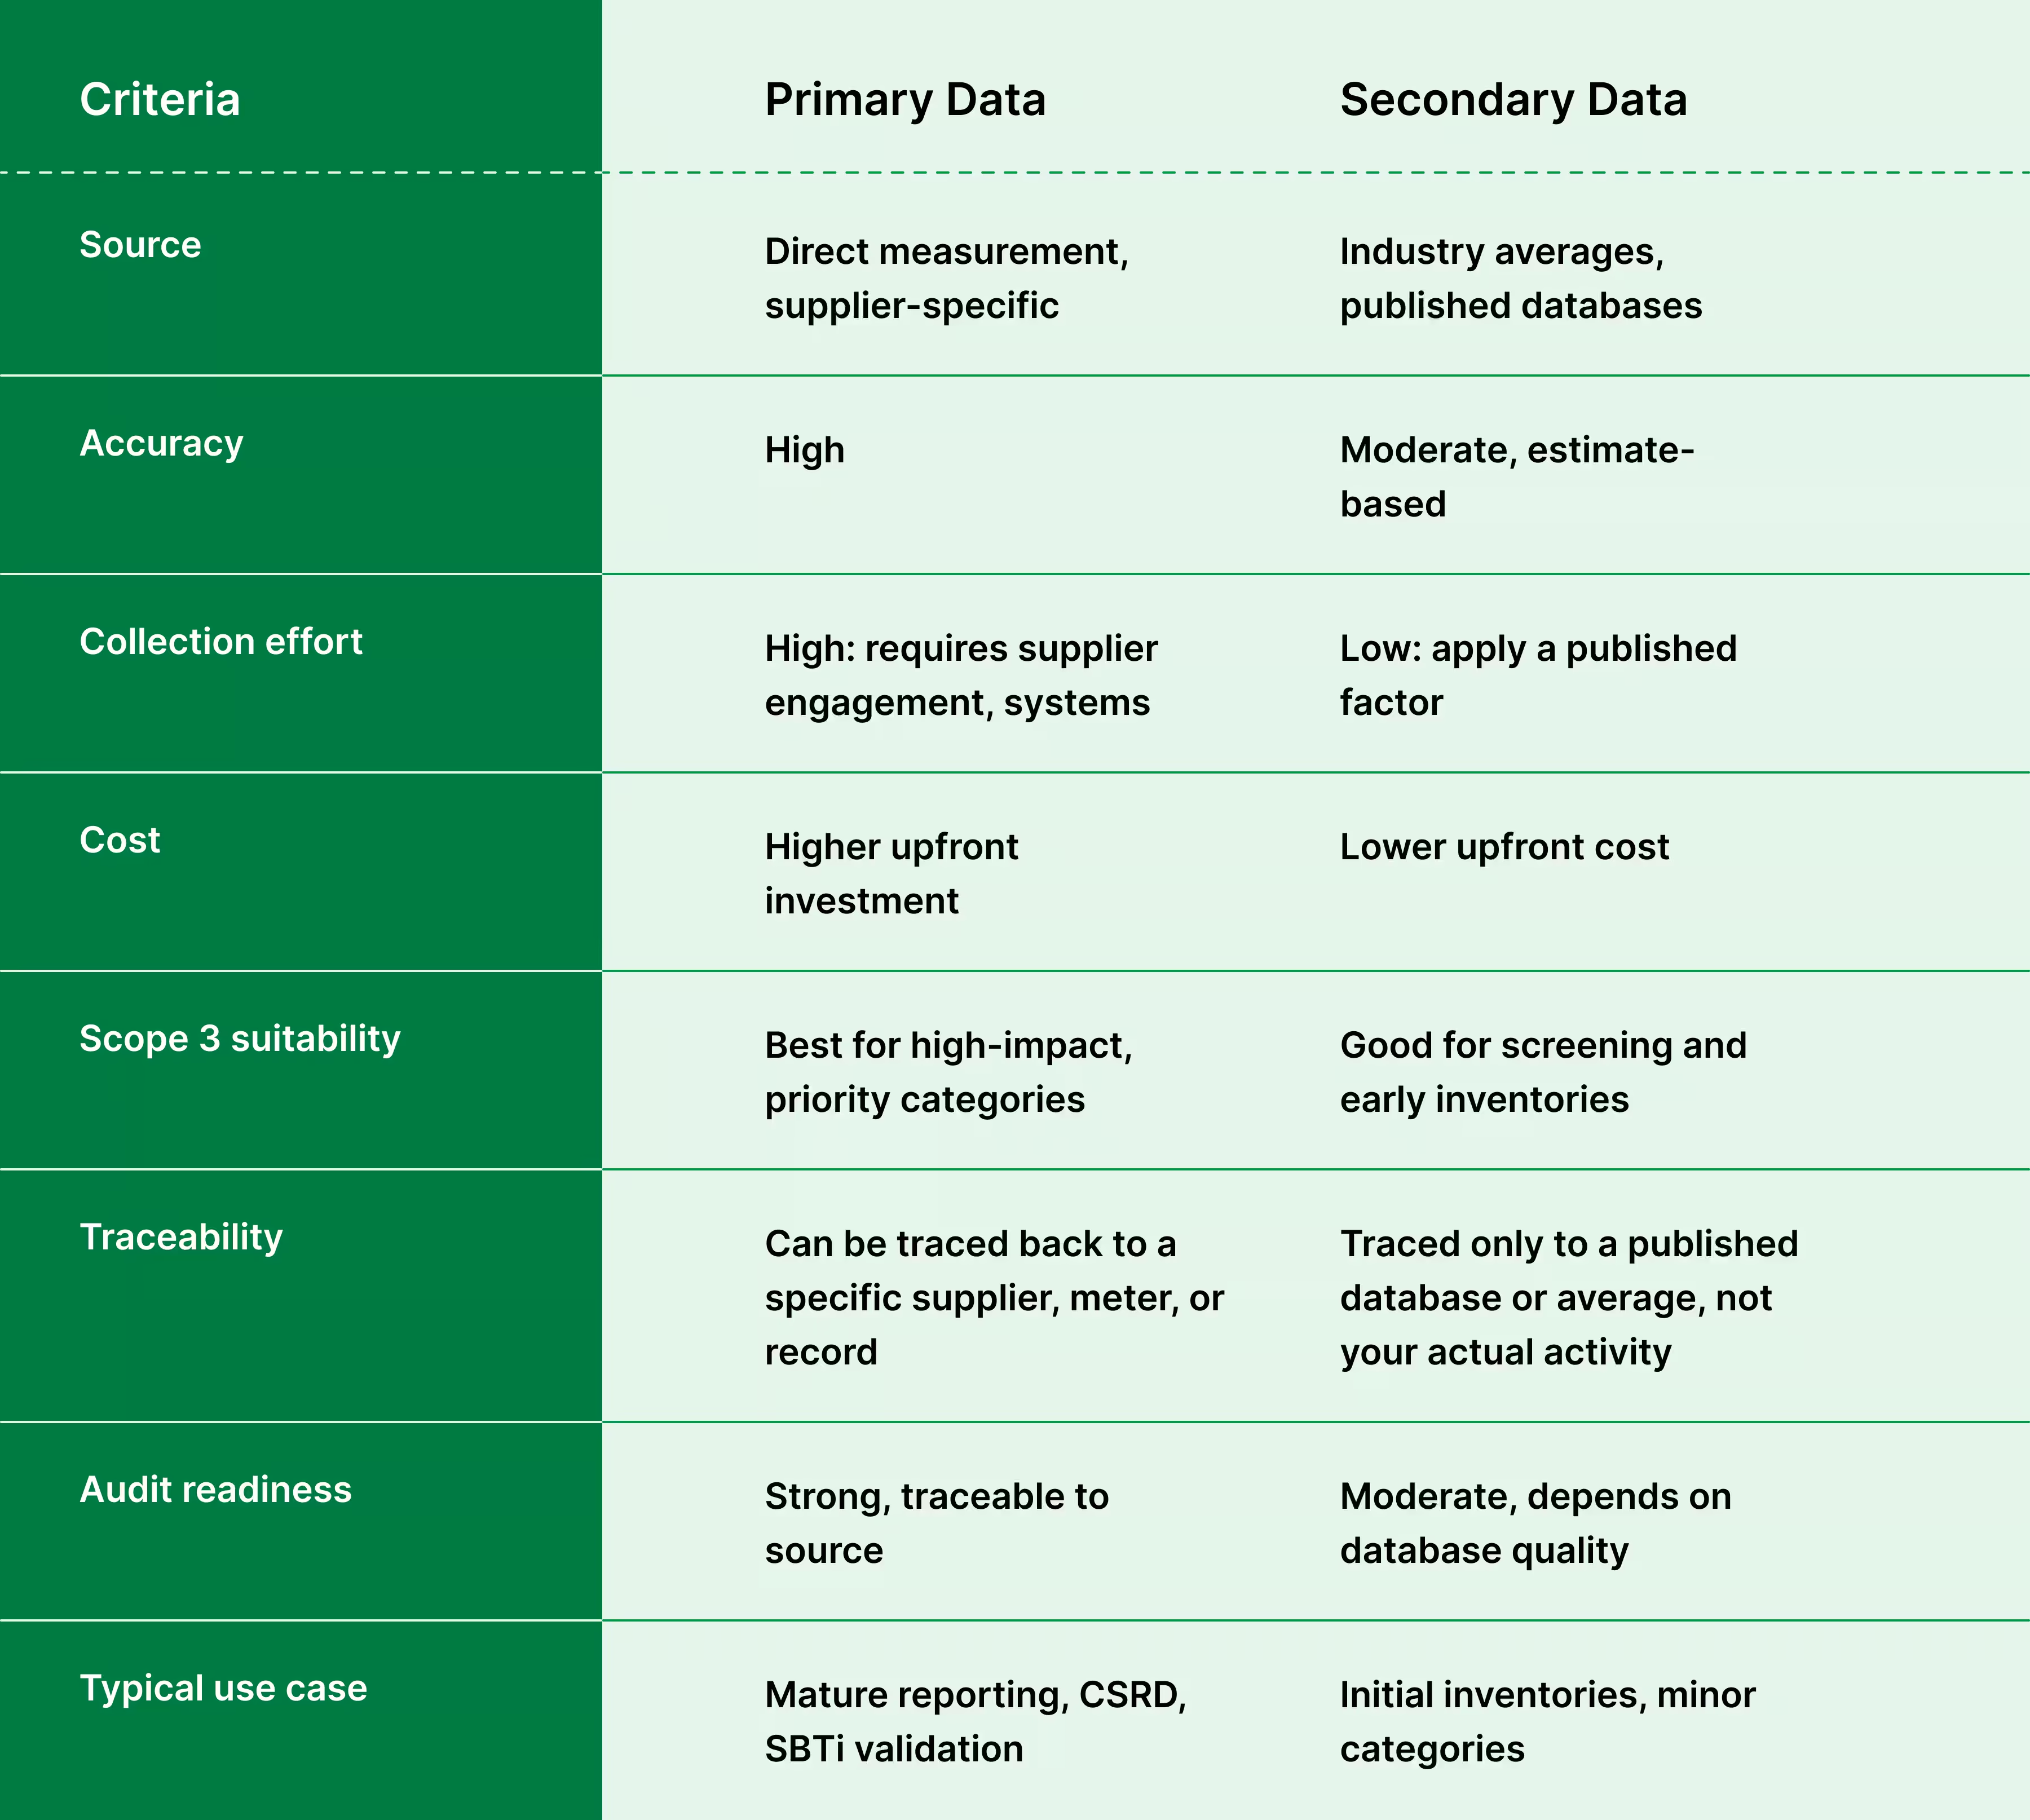
Because it reflects what actually happened, primary data is more accurate, more defensible in an audit, and easier to trace back to its source. It also costs more to collect. Someone has to request it, verify it, and keep it current.
What Is Secondary Emissions Data?
Secondary data is estimated. It comes from published emission factor databases or industry averages rather than direct measurement, and it's applied to activity data (like spend or weight) to approximate an emissions figure.
Common sources include:
- DEFRA (UK) conversion factors
- EPA emission factor databases
- IPCC default factors
- ecoinvent, a widely used life cycle inventory database
- EXIOBASE, an environmentally extended input-output database used for spend-based estimates
Secondary data lets you produce a complete inventory quickly, even in categories where you have no supplier relationship or no way to request activity data. The tradeoff is precision: an industry average can't reflect what one specific supplier or process actually emits.
Why that gap matters in practice: picture two suppliers making the same grade of steel. A spend-based secondary factor assigns them identical emissions per tonne purchased, since it's built on an industry average, not on either supplier specifically. In reality, one supplier running on a cleaner grid with better process efficiency could carry a footprint meaningfully lower than that average, while a less efficient supplier on a coal-heavy grid could sit well above it. Neither number is visible until you ask for primary data. At the scale of a company's top suppliers, that hidden spread is often the difference between an inventory that'sdirectionally right and one precise enough to act on.
How the Major Standards Treat This Distinction
The GHG Protocol Scope 3 Standard doesn't ask companies to use only primary data. It asks companies to prioritise it for high-impact activities and to improve data quality over time, using secondary data (including proxy data) to fill gaps where primary data isn't yet available. The standard's calculation guidance ranks methods by specificity: supplier-specific and hybrid methods (which use direct supplier data) rank above average-data and spend-based methods (which rely on secondary data).
ISO 14064 sets the technical specification for GHG inventories and verification, and expects organisations to document their data sources and uncertainty regardless of which type they use.
CDP requires third-party verification covering 100% of Scope 1 and Scope 2 emissions, plus at least 70% of a minimum of one Scope 3 category, for A List eligibility. CDP's questionnaire is also fully aligned with IFRS S2, so the same underlying data quality expectations carry across both frameworks.
If you report under CSRD, you're already living a version of this. ESRS E1 expects you to show what share of your Scope 3 numbers actually come from primary data, not just a blended total. So if nobody on your team has calculated that percentage yet, that's worth doing now regardless of what the GHG Protocol eventually finalises, since the GHG Protocol's proposed disaggregation is really just formalising, at a more granular level, something CSRD reporters are already expected to work out.
SBTi adds a related pressure point. Near-term science-based targets are required to cover at least 67% of a company's Scope 3 emissions, and SBTi assessors reference the GHG Protocol's own calculation hierarchy when weighing how that coverage was calculated. A target built mostly on spend-based estimates draws more scrutiny than one backed by supplier-specific figures for the categories that matter most.
None of these standards expect perfect data on day one. What they consistently reward is a visible, improving trend toward primary data over time, and a company's ability to show its working.
How the Balance Shifts by Scope
Primary and secondary data aren't distributed evenly across a footprint. The realistic split looks different depending on which scope you're measuring.
{{blurb}}
What's Changing: The GHG Protocol's 2026 Scope 3 Revision
That scope-by-scope split is the picture as things stand today. It's also about to become a lot more visible, and this is the part most guides on this topic don't cover yet, because it's new.
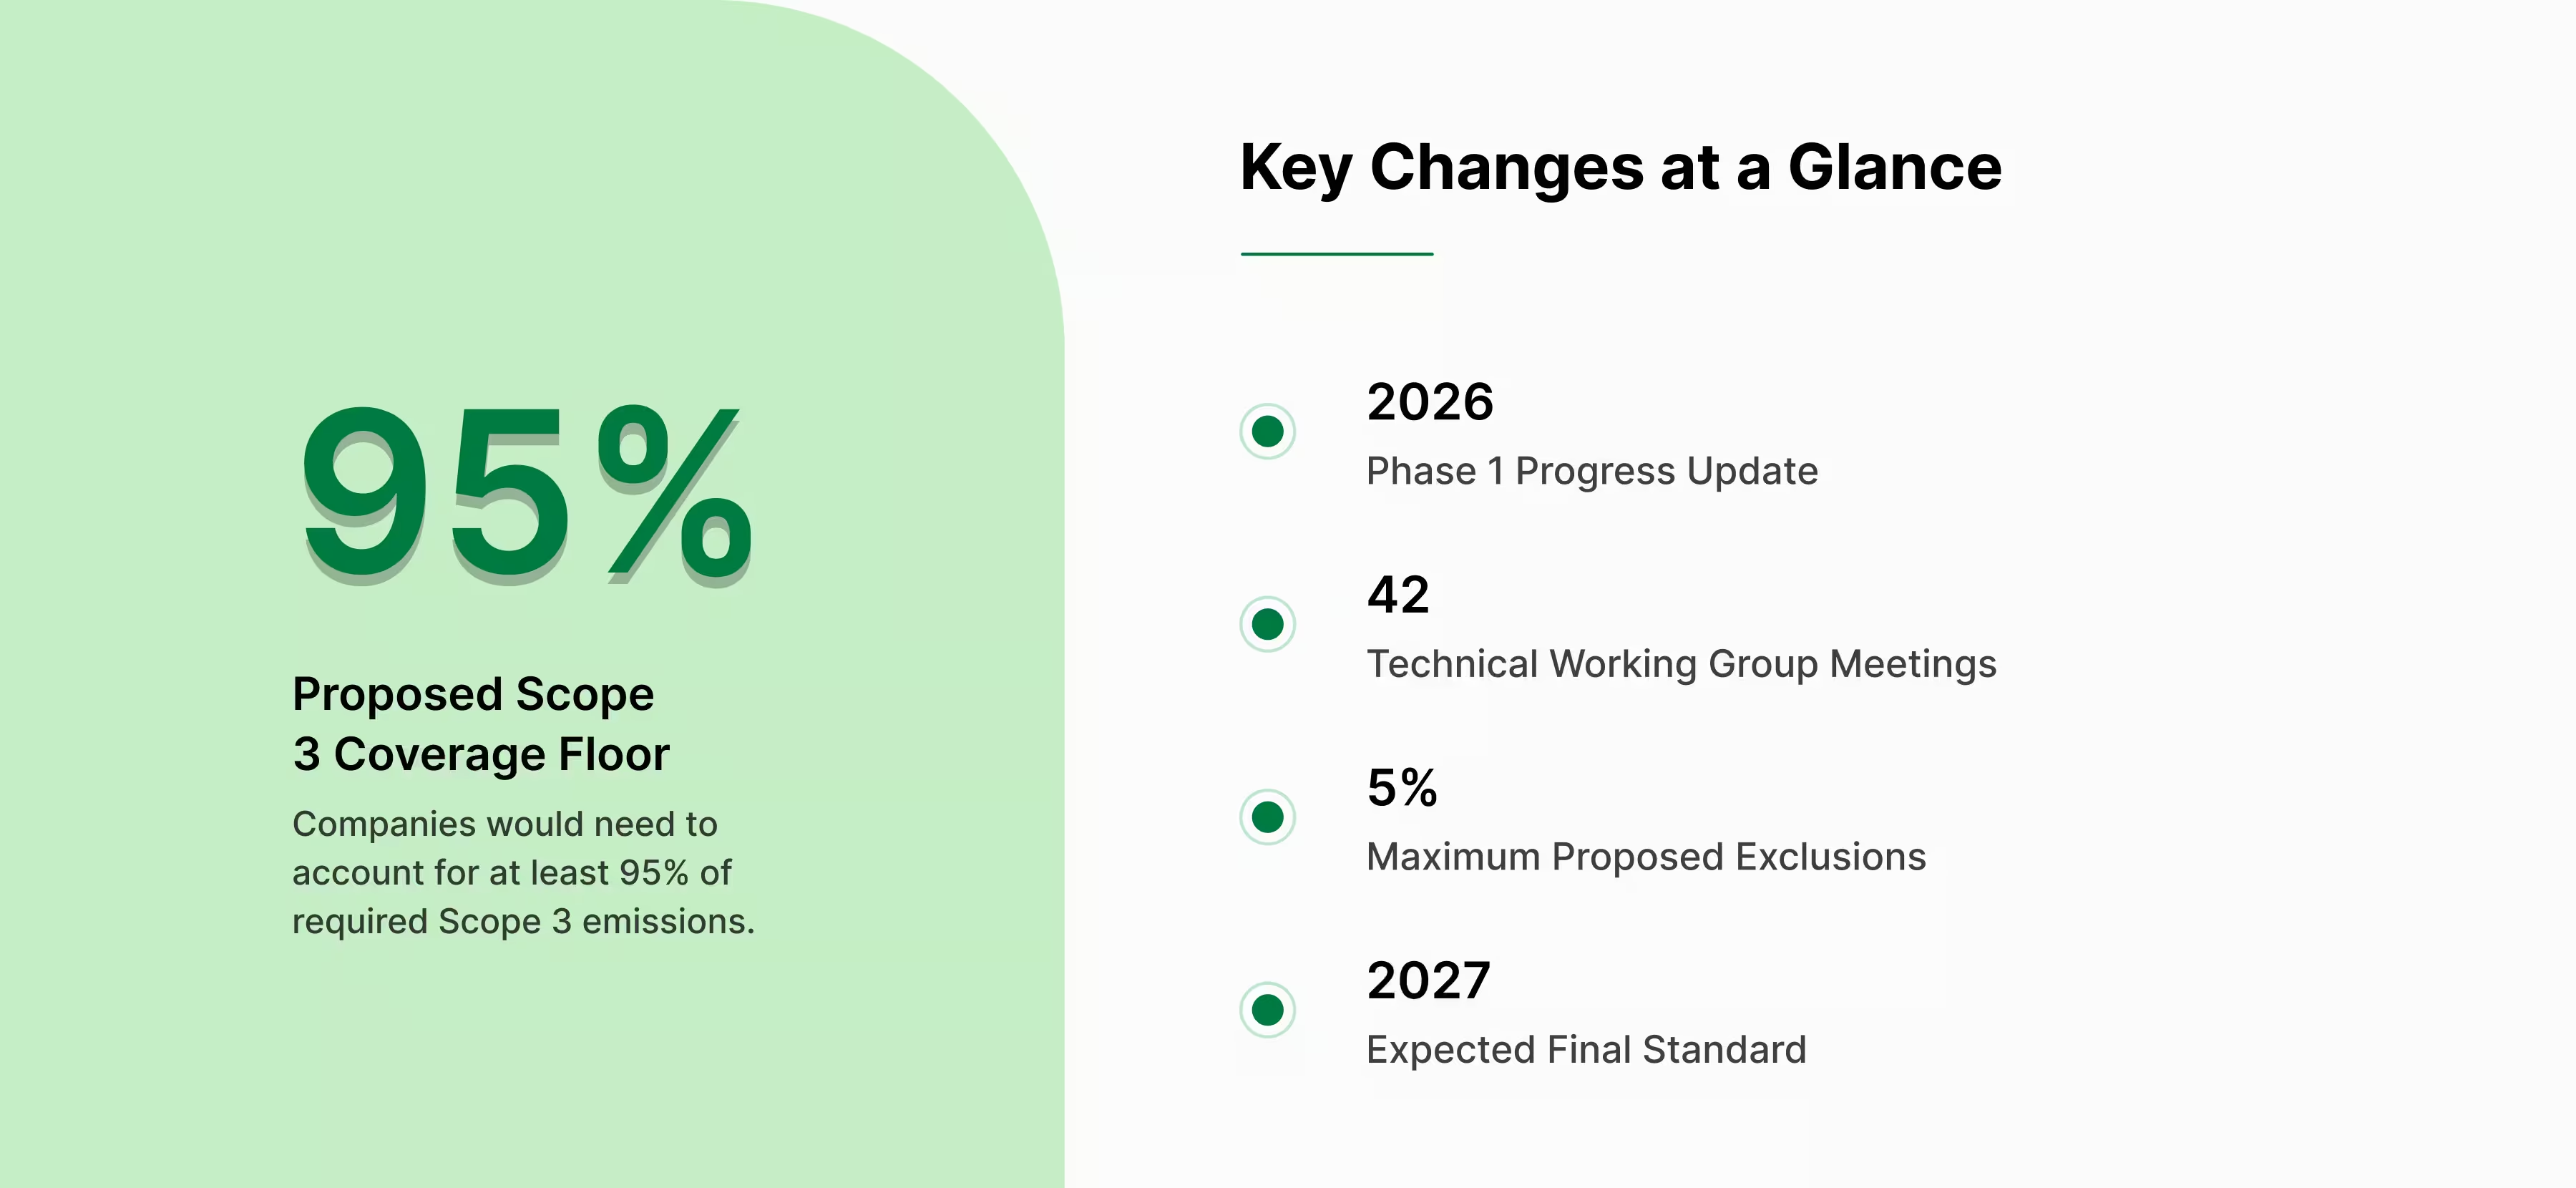
On 31 March 2026, the GHG Protocol published a Phase 1 Progress Update on its plan to revise the Scope 3 Standard for the first time since 2011. It is a working draft, not a final standard, developed by a Technical Working Group that held 42 meetings between September 2024 and the end of 2025. A complete draft standard for public consultation is expected to follow later in the revision process, with the final standard anticipated in 2027, though the GHG Protocol has not yet published a firm date for the consultation draft itself.
Three proposals matter most for this topic:
Data quality disaggregation. Companies would be required to break down reported Scope 3 emissions by data type for each category, rather than reporting one blended number. The GHG Protocol is still finalising exactly how granular this classification will be. Rather than a simple primary-versus-secondary split, the working draft is weighing multiple data-quality tiers, potentially distinguishing primary or activity-based data, hybrid methods, average-data methods, and spend-based estimates, with one option under consideration combining data source and calculation method into a single classification. Whatever the final shape, the direction is the same: the proportion of a company's inventory built on spend-based estimates would, for the first time, be visible and comparable across companies.
A 95% coverage floor. Companies would need to account for at least 95% of required Scope 3 emissions, with any exclusions capped at 5% and requiring documented, quantified justification, replacing today's looser "disclose and justify" language.
Tighter rules on corporate-level supplier data. For diversified suppliers, where emissions intensity varies meaningfully between business units or product lines, the draft would restrict companies from allocatinga supplier's corporate-average footprint across everything they buy from that supplier. Companies would need to move down the data hierarchy toward product-, facility-, or business-unit-level figures instead. This would directly affect Category 1 inventories currently built on supplier corporate averages, worth checking for if that shortcut is in use anywhere in your own reporting.
Because SBTi's methodology explicitly references the GHG Protocol, and because CDP and IFRS S2 already align closely with it, this revision is likely to ripple into those frameworks too, even before it's finalised. The direction is clear: reliance on secondary data is shifting from a normal starting point to something that has to be actively justified and tracked over time.
This isn't cause for alarm, since the standard is still in draft. It is a good reason to start knowing your own primary-to-secondary ratio now, category by category, so the transition isn't a scramble later.
With that regulatory direction in mind, here's how the two data types actually compare on the ground.
Primary vs Secondary Emissions Data: Side by Side
When to Use Primary Emissions Data
Reach for primary data when the stakes or the scrutiny are high:
1. High-impact categories. If a single Scope 3 category accounts for a large share of your footprint, an industry average there carries too much uncertainty.
2. Regulatory reporting under CSRD. ESRS E1 expects companies to show how they're improving data quality, and reviewers increasingly look for supplier-specific figures in material categories.
3. Product carbon footprints. A customer asking for a PCF wants a number tied to your actual production, not a sector average.
4. Science-based target validation. SBTi assessors look for the calculation method behind a target, and average-data or spend-based methods carry more scrutiny than supplier-specific figures.
5. Audited or third-party verified disclosures, where every number needs a traceable source.
6. Established supplier relationships, where the data is realistically obtainable without a multi-year engagement effort.
When to Use Secondary Emissions Data
Secondary data isn't a lesser option. It's the right tool in specific situations:
1. Building your first carbon inventory. You need a complete baseline before you can prioritise where to improve it.
2. Categories where supplier data doesn't exist yet. You can't collect what isn't available; secondary data fills the gap responsibly in the meantime.
3. Screening-level Scope 3 assessments, where the goal is identifying hotspots, not achieving audit-grade precision.
4. Minor or immaterial categories, where the cost of primary data collection outweighs the accuracy gained.
5. Benchmarking and scenario modelling, where directional accuracy matters more than exact figures.
Almost every company uses both. The real skill isn't choosing one over the other. It's knowing which categories deserve the investment in primary data first.
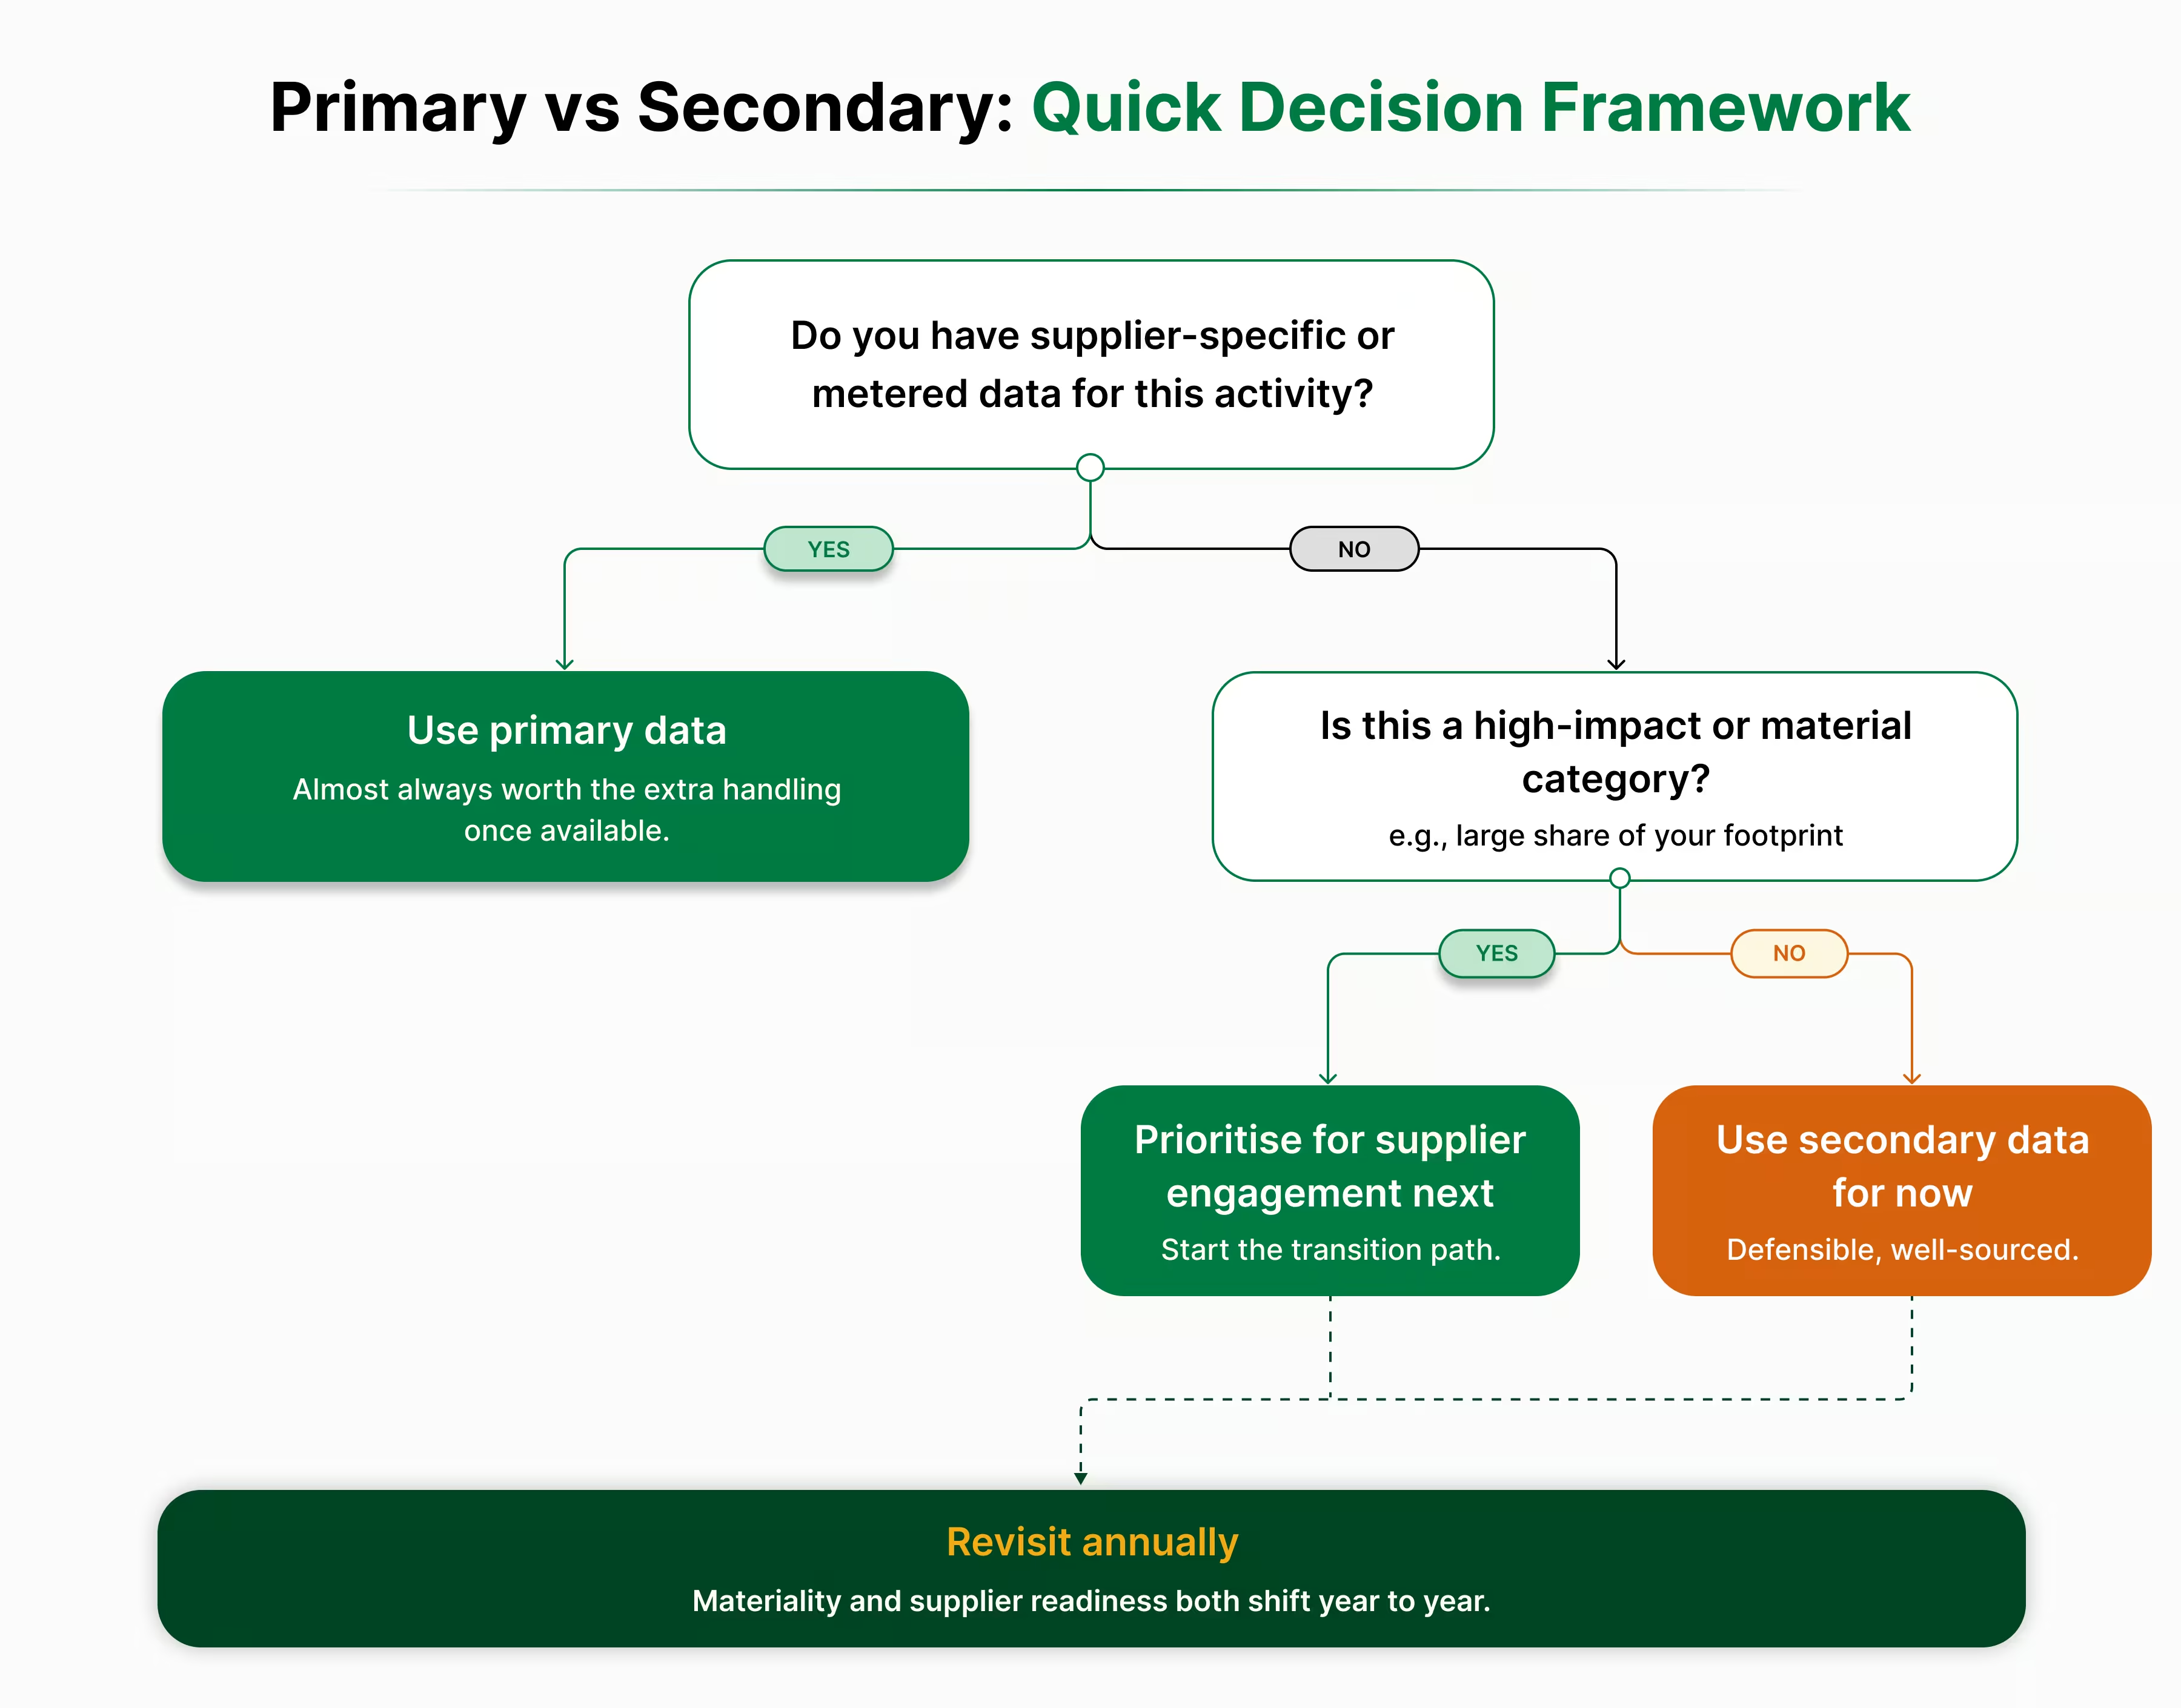
Quick decision snapshot Do you already have supplier-specific or metered data for this activity? If yes, use it. If not, is this a high-impact or material category? If yes, prioritise it for supplier engagement next. If not, a well-sourced secondary factor from a recognised database is a reasonable, defensible choice for now. Revisit annually. Materiality and supplier readiness both shift year to year.
Moving from Secondary to Primary Data: A Practical Path
Knowing where you stand today, and where the GHG Protocol's proposed changes are heading, only matters if you also have a plan for closing the gap. Here's a practical path:
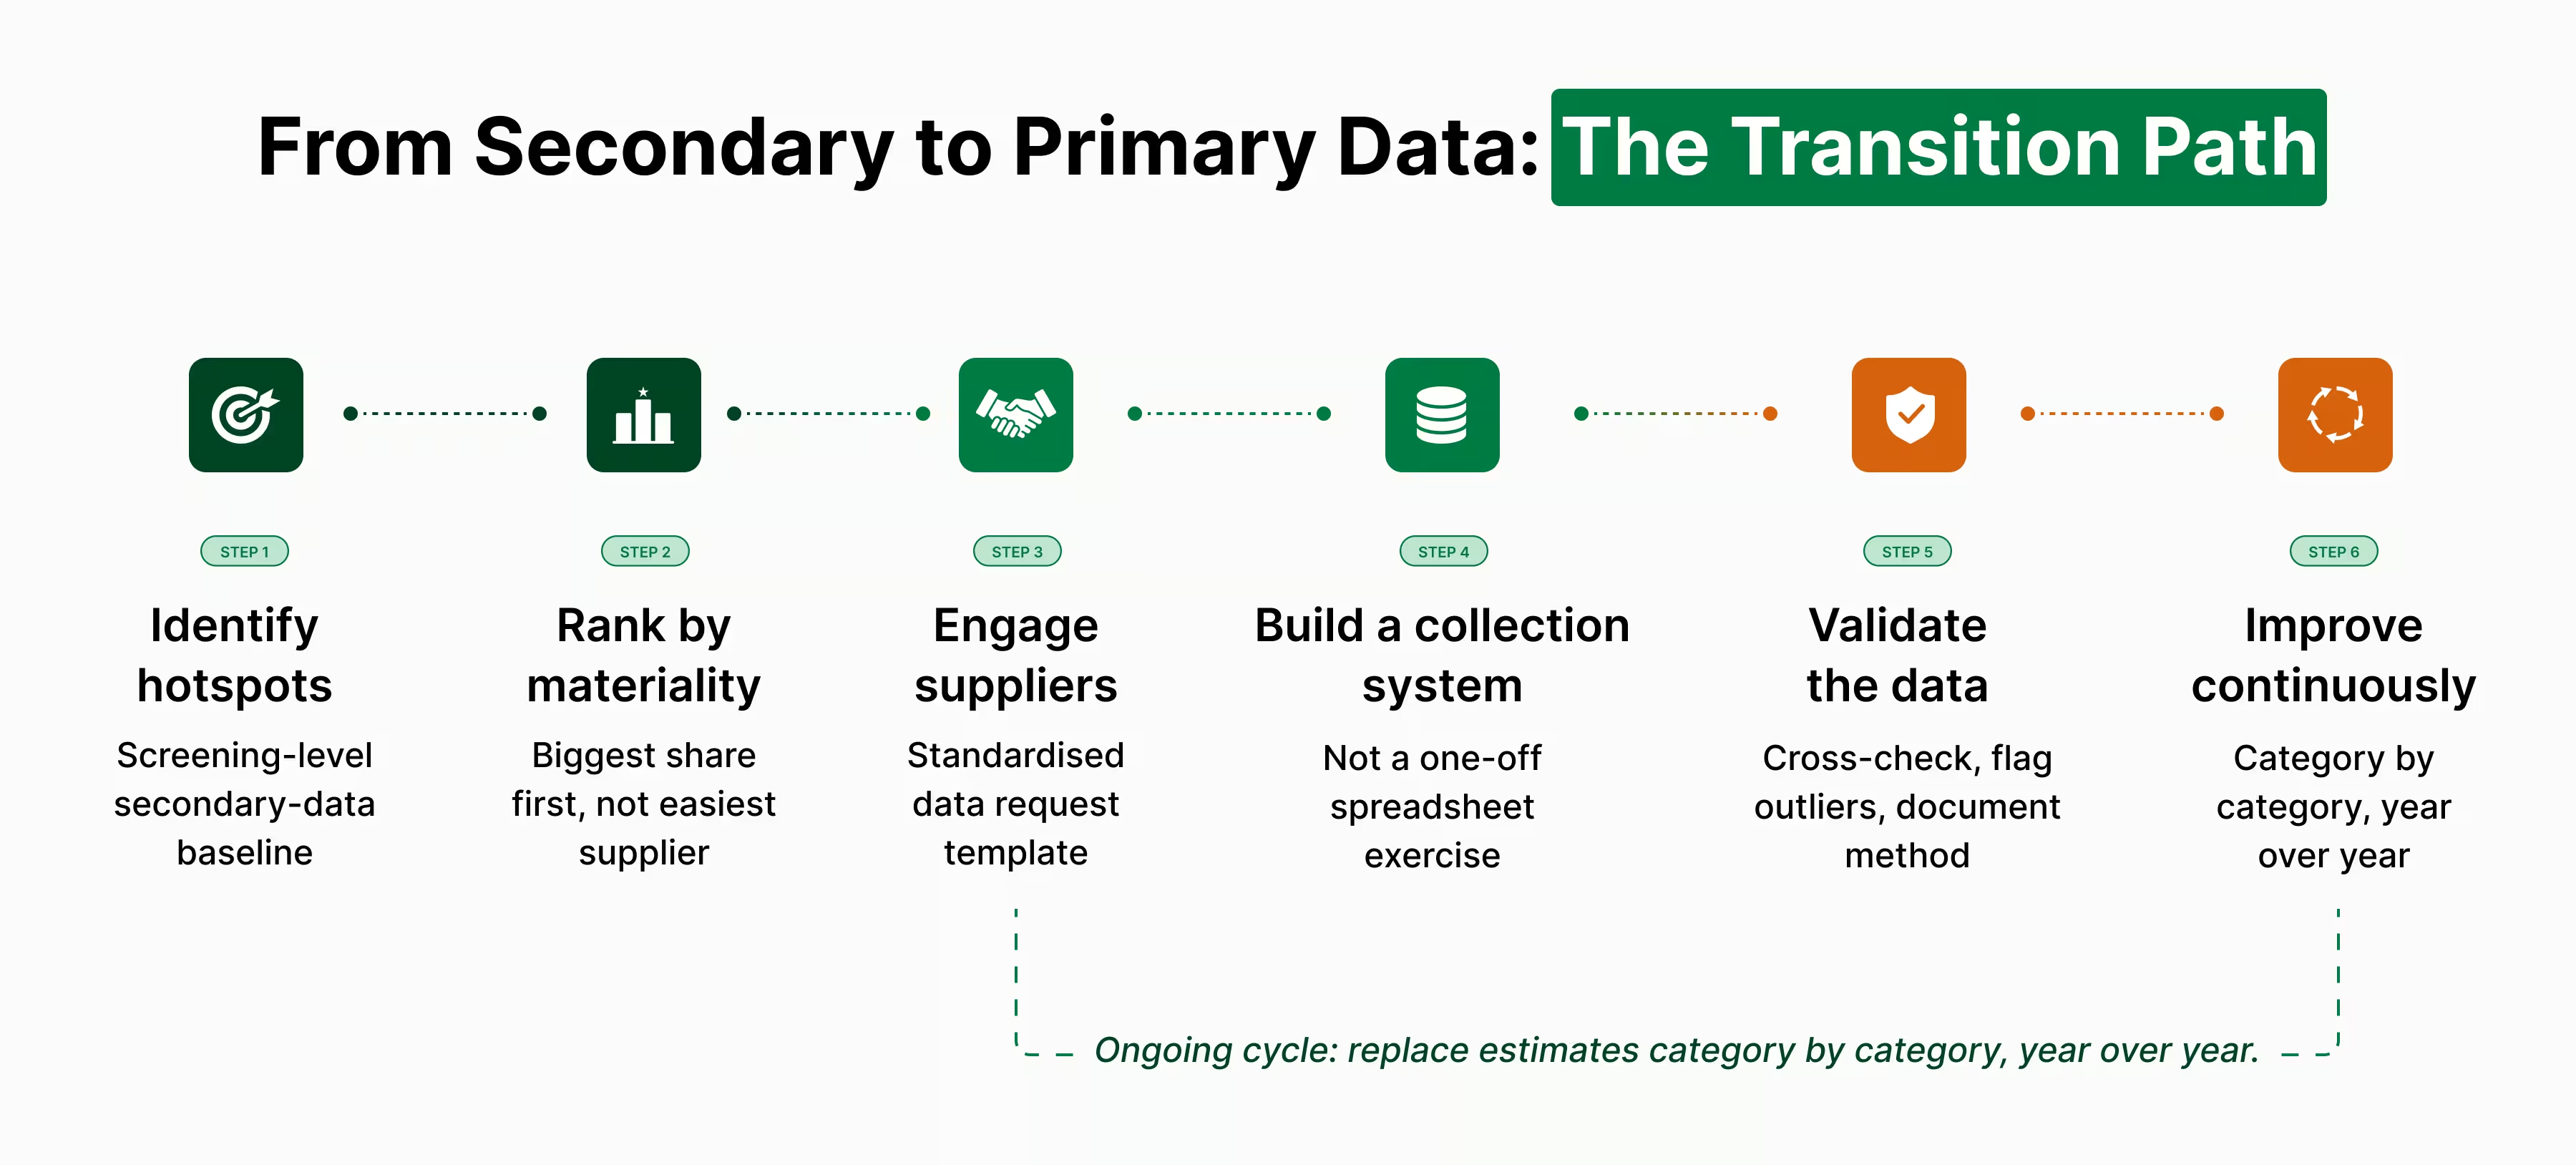
Step 1: Identify your hotspots. Run a screening-level inventory using secondary data first. You can't prioritise what you haven't measured.
Step 2: Rank categories by materiality, not convenience. The categories worth chasing primary data for are the ones with the biggest emissions share, not the ones with the easiest suppliers to reach.
Step 3: Engage suppliers with a clear, simple ask. A standardised data request template, asking for the same units and boundaries every time, gets a far higher response rate than a bespoke email per supplier.
Step 4: Build a system to collect it, not a one-off exercise. A spreadsheet works for a pilot. It doesn't survive a second reporting cycle. Look at how activity data flows from procurement and ERP systems into your inventory, and automate that link where you can.
Step 5: Validate before you rely on it. Cross-check supplier figures against expected ranges, flag outliers, and document your methodology so an auditor can follow it later.
Step 6: Treat this as ongoing, not a one-time project. Replace estimates category by category, year over year. The GHG Protocol's own guidance frames this as continuous improvement, not a pass/fail test.
How This Plays Out in Practice
The following is an illustrative composite, not a specific named company, built from patterns typical of mid-sized manufacturers running this kind of transition.
A mid-sized industrial manufacturer starts its first Scope 3 inventory almost entirely on secondary data: spend-based EEIO factors applied to procurement records across purchased goods and services. The baseline is complete within a quarter, and it does its job, giving the sustainability team a first view of where emissions concentrate.
The screening shows one category, purchased goods and services, accounts for more than half the inventory. That's where primary data collection starts. The team sends a standardised data request to its top 20 material suppliers by spend, asking for product-level carbon footprints rather than a company-wide average. Roughly a third respond in the first cycle. The rest are followed up the next year, with the request folded into existing procurement renewal conversations rather than sent as a stand-alone ask.
Two reporting cycles later, that one category has shifted from 100% spend-based estimate to roughly 60% supplier-specific data, with the remaining 40% still filled by secondary factors and clearly labelled as such. The total inventory figure changes only modestly, but the auditability improves sharply, and the company can now show a documented, rising primary data share for its most material category, which is exactly the kind of trend line CDP's scoring and the GHG Protocol's proposed disaggregation both reward.
Nothing about this is fast. What makes it work is treating the transition as an ongoing category-by-category programme rather than a one-off data cleanup.
Where This Gets Difficult
A few obstacles come up on almost every primary data project, and they tend to fall into two buckets: friction outside your organisation, and discipline inside it.
External friction:
Suppliers are cautious about sharing data. Framing the request around shared reporting benefits, rather than a compliance demand, generally gets a better response than a cold data request.
Data doesn't arrive in consistent units or boundaries. Standardising your request template up front avoids a painful reconciliation exercise later.
Some Scope 3 categories stay stubbornly incomplete. Document what's missing and why, rather than quietly filling the gap with a rough proxy. Under the proposed coverage floor, undocumented exclusions won't hold up the way a quiet drop of a hard category used to.
Internal rigor:
Treating all secondary data sources as equally reliable. A national government database and a rough industry proxy are not the same tier of evidence.
Using an emission factor that's several years out of date without checking for an updated version. DEFRA, EPA, and similar databases update annually, and a factor that was reasonable two years ago may already be stale.
Mixing calculation methods within the same category without documenting why.
Waiting for perfect supplier data before starting, and ending up with no inventory at all.
Not documenting assumptions, so nobody, including your own team a year later, can reconstruct how a number was built.
Tools and Technology for Managing Emissions Data
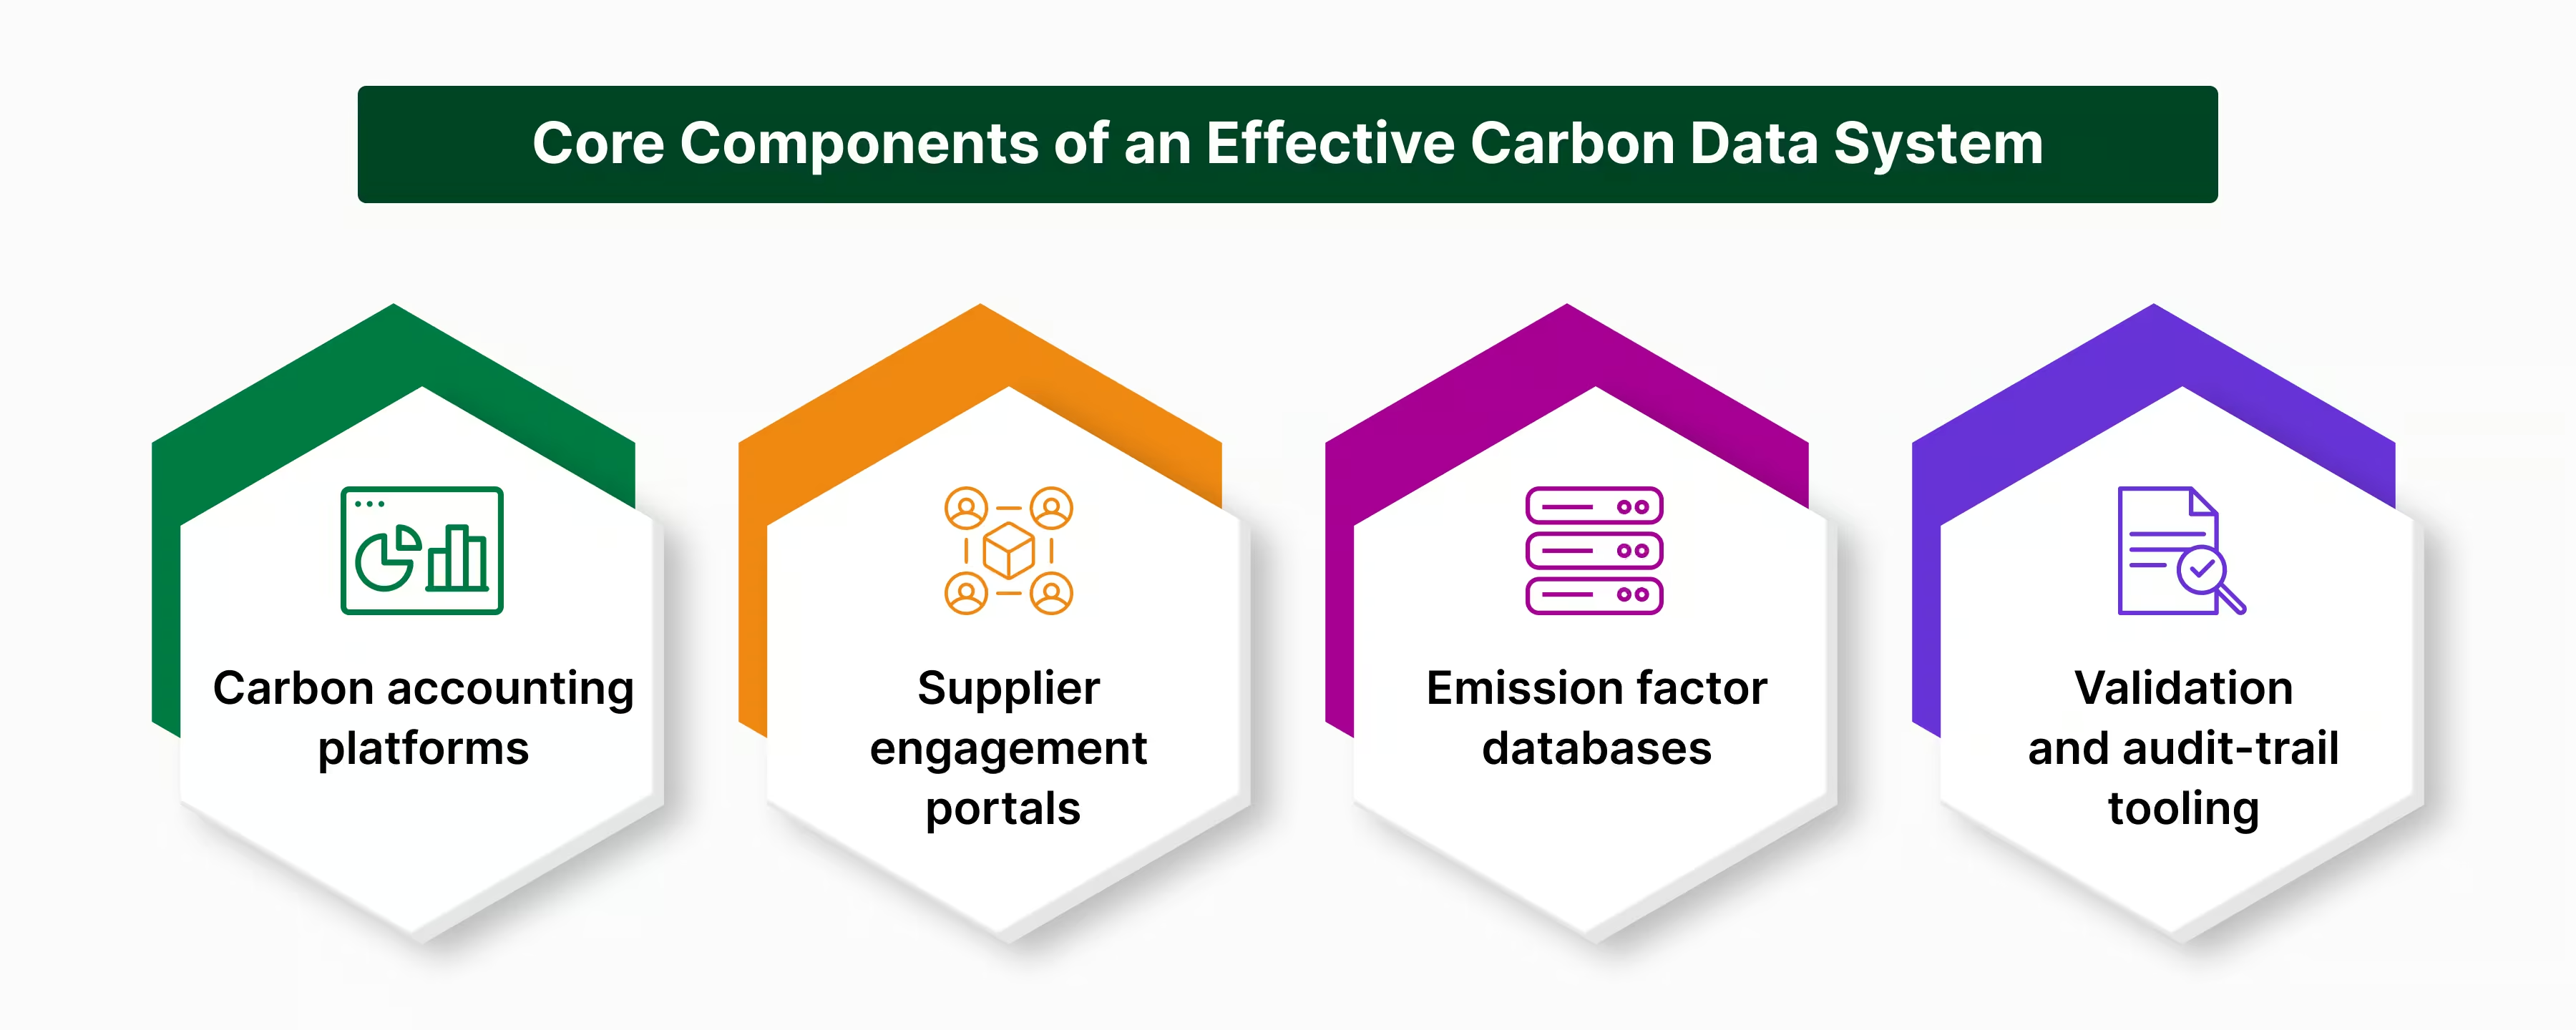
The mechanics of shifting from secondary to primary data usually come down to a handful of categories of tooling:
Carbon accounting platforms centralise activity data, apply emission factors, and calculate totals across Scope 1, 2, and 3, giving you one place to see how much of your inventory is primary versus secondary at any point in time.
Supplier engagement portals handle the repetitive, high-volume work of requesting, chasing, and standardising supplier data. For most teams, this is the single biggest bottleneck in any primary-data project, more than the analysis or the calculations themselves.
Emission factor databases, DEFRA, EPA, IPCC, ecoinvent, and similar sources, need to be current. Manually tracking which factors are due for their annual refresh is easy to fall behind on once you're covering more than a handful of categories.
Validation and audit-trail tooling matters more as scrutiny increases. Being able to show which figure came from where, and by what method, is what turns a defensible number into an audit-ready one.
Good tooling doesn't need to be sophisticated from day one. It just needs to hold both data types side by side and make the transition between them visible, rather than forcing a rebuild every time a category improves.
Where KarbonWise Fits
If you're staring down a Scope 3 inventory that's 80% spend-based estimates and wondering how you'll ever show a rising primary data share once GHG Protocol's disaggregation requirement lands, that's the specific gap KarbonWise's platform is built to close.
KarbonWise lets you record both primary and secondary data against the same inventory, so switching a category from estimate to supplier-specific figures doesn't mean rebuilding your reporting from scratch: verified supplier inputs replace estimates automatically as they come in. Its supplier engagement tools reach suppliers directly and track progress by site, supplier, and category, addressing the bottleneck described above. Where supplier data isn't yet available, the platform applies fallback values from recognised databases with clear flags, so it's always visible which figures are estimated and which are verified. Every inventory carries a visible data quality trail by category, with full traceability and version control behind each figure, which is exactly the kind of disaggregation the GHG Protocol's proposed revision is moving toward.
The goal isn't a perfect inventory in year one. It's a documented, improving one, with a clear line of sight into where your primary data share stands today and where it needs to go next.
The Bottom Line
Primary and secondary emissions data aren't competing approaches. They're two tools for two different jobs. Secondary data gets you a complete, credible baseline fast. Primary data gets you the precision that audits, science-based targets, and increasingly, the standards themselves, are starting to demand.
You'll be best positioned as the GHG Protocol's revised Scope 3 Standard takes shape not by scrambling to replace every estimate overnight, but by already knowing, category by category, where your primary data share stands today, and having a documented plan for moving it forward.
Ready to see where your data quality stands? Request a Demo | KarbonWise Platform to see how KarbonWise helps you track, improve, and report on primary and secondary emissions data in one platform.
{{cta}}
{{accordion}}
{{sources}}




Continue Reading
%20(1).avif)
Top 5 ESG Software Platforms in 2026: Features and Use Cases
Compare the top 5 ESG software platforms in 2026, their key features, use cases, and reporting capabilities to find the right fit for your organisation.

How to conduct a double materiality assessment: A practical step-by-step guide (2026)
Learn how to conduct a Double Materiality Assessment with this practical step-by-step guide covering impact and financial materiality, IROs, stakeholder engagement, scoring, materiality matrices, and ESG reporting.

Netflix, Binge-Watching & the Hidden Carbon Footprint of Streaming Culture
Streaming feels effortless, but every Netflix session relies on data centres, networks, and devices that consume energy continuously. Discover the hidden carbon footprint of streaming culture and learn simple ways to reduce your digital impact.


.avif)









.svg)
.svg)